Financial Services
Saving 600 Person-Hours Every Week Through Data Infrastructure Modernization

Impact Snapshot
IMPACT SNAPSHOT
We made a visible and measurable impact to our client’s business.
- 600 person-hours saved every week by reducing manual reporting effort
SCALE OF TRANSFORMATION
- 500+ tables migrated
- 14 data sources integrated
- 30 business-critical KPIs enabled across key business processes
The engagement reduced the effort spent preparing reports while creating end-to-end visibility across the customer lifecycle and a centralized foundation for analytics and future AI applications.
Challenge
INDUSTRY OVERVIEW
Lending and financial services businesses generate data across multiple stages of the customer lifecycle, including lead generation, loan origination, servicing, partner operations, disbursement and collections.
As these businesses scale, data often remains distributed across operational systems built for different purposes. This makes it harder to create a consistent view of performance, slows reporting and increases the amount of manual effort required to prepare information for business teams.
A modern data foundation must therefore do more than consolidate information. It needs to support repeatable data processing, governed access, timely reporting and future analytical use cases without increasing operational complexity.
THE PROBLEM
A leading education-focused NBFC was operating with LMS, LOS and other application data spread across multiple systems.
The existing architecture did not provide a centralized environment capable of bringing these datasets together for end-to-end analytics. In particular, LOS data was not available within a common data lake or data warehouse, creating integration challenges and limiting visibility across the journey from lead generation and disbursement to debt collection.
The existing architecture also had limitations around the migration of unstructured LOS data and needed to accommodate future data growth, automation, real-time analytics and AI/ML requirements.
Without a centralized data foundation, reporting remained effort-intensive and the business lacked a consistent view across important customer and operational processes.
OUR ROLE
Ganit was brought in to modernize the organization’s data infrastructure and establish a centralized architecture connecting LMS, LOS and other enterprise data sources.
The mandate was to reduce data silos, automate recurring reporting workflows, improve visibility across the customer lifecycle and create a data foundation that could support both current BI requirements and future Applied AI initiatives.
Our approach
METHODOLOGY
The engagement was structured around three core questions.
How can data from multiple operational systems be brought into one consistent analytical environment?
The first priority was to consolidate data that was distributed across LMS, LOS, partner systems and other internal and external sources.
How can that data be converted into information that business teams can use without depending on manual reporting?
The next step was to create structured datasets and business KPIs that could directly support reporting and decision-making.
How can the architecture continue supporting the business as data volumes and analytical requirements grow?
The platform therefore had to support repeatable processing, orchestration, governance and additional BI or AI use cases without requiring the core infrastructure to be rebuilt.
SOLUTION STRUCTURE
We built an integrated data system to enable this at scale.
Layer 1: Centralized Data Foundation
Data from LMS, LOS, partner databases and other internal and external systems was consolidated into a centralized data lake and warehouse environment.
More than 500 tables from 14 data sources were migrated, reducing fragmentation and creating a common analytical foundation for the organization.
Amazon S3 supported data storage, while Amazon EMR and AWS Glue were used to process and transform information. Amazon Athena and Amazon Redshift supported analytical querying and structured business consumption.
Layer 2: Business Analytics and Decision Support
The centralized environment was structured around 30 business-critical KPIs covering key processes including:
- Partner onboarding
- Partner journey
- Lead to disbursement
- Portfolio assessment
This allowed business teams to move from fragmented reporting towards a more consistent view of operational and customer performance. BI capabilities were connected to the centralized data environment so users could access business information without repeatedly compiling data from multiple systems.
Layer 3: Data Pipelines and Orchestration
Automated pipelines were established to ingest, process and curate incoming data.
AWS Glue, Amazon EMR and supporting orchestration components were used to create repeatable processing workflows, while access controls and security components governed how data was consumed.
The cloud environment was also simplified into a single AWS account, reducing infrastructure complexity while improving governance and operational control.
ENABLING CONSUMPTION
The platform was designed around how business teams would ultimately consume the information.
Rather than stopping at data migration, the engagement connected centralized datasets with BI and reporting workflows. Business-critical KPIs were organized around operational processes such as partner onboarding, lead conversion, disbursement and portfolio assessment, making the resulting data directly relevant to day-to-day decision-making.
Automating reporting workflows also reduced the effort previously required to prepare and reconcile information manually.
The resulting architecture created a reusable foundation for additional reporting, analytics and Applied AI use cases without requiring teams to reconstruct the underlying data layer for every new requirement.
A valuable difference
OUR IMPACT
The modernization shifted reporting from a fragmented, effort-intensive process towards a centralized and automated data environment.
The most significant measurable outcome was the elimination of approximately 600 person-hours of manual effort every week, allowing business teams to spend more time interpreting information and making decisions rather than preparing reports.
At the same time, migrating 500+ tables across 14 data sources created a broader view of enterprise information, while 30 business-critical KPIs improved visibility across important stages of the lending and customer lifecycle.
The organization also gained a simpler cloud environment and a centralized data foundation capable of supporting future BI, analytics and AI requirements.



MANUFACTURING
Reducing QC Story Documentation Effort by 80%+ Through AI-Guided Automation

CUSTOMER OPERATIONS
Cutting Customer Email Response Time by 98% Through Agentic AI Automation
CAPITAL MARKETS
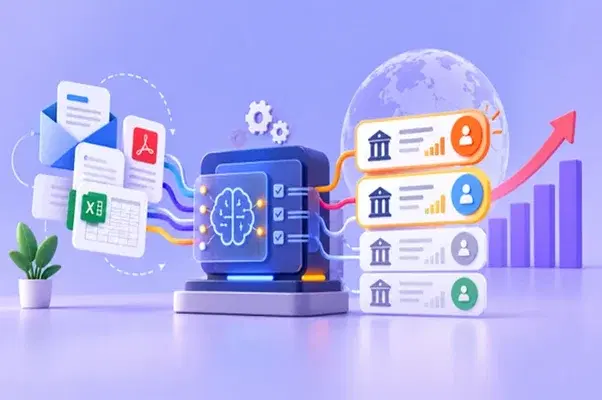
Reducing Investor Meeting Prioritization Turnaround to Under One Hour with AI

RETAIL
Our data science solutions helped a major retailer reduce its wastage by 20% in Fruits and Vegetables category

RETAIL
We developed a sales forecasting engine for a CPG company in Africa leading to a 12% increase in forecast accuracy

CPG
We helped an Indonesian CPG leader realizer a 10% increase in ROI in their Promotional Strategy using Dynamic Pricing Optimized (DPO)

CPG
Our recommendation engine helped one of the largest CPG companies achieve additional 12% revenue lines for the company

HEALTHCARE & PHARMACEUTICALS
We helped a pharma leader reduce their time for drug development by cutting their initial research time by 65%

HEALTHCARE & PHARMACEUTICALS
We partnered with a leading pharmaceutical company to develop HCP Persona Analytics Engine leading to an incremental 35% lift in their engagement

BFSI
We helped an NBFC realize dynamic pricing recommendations leading to an incremental revenue lift of 3%
BFSI
We transformed portfolio management through intelligent automation with 90% reduction in man-hours

RESTAURANTS & HOSPITALITY
We partnered with one of the biggest food chains to deploy a data-driven system leading to a 22% increase in revenue

LOGISTICS
We helped a major logistic company achieve 100% if its SLA using our route optimizer & resource management solution
MANUFACTURING
We partnered with a global manufacturer to restore high quality production line

MANUFACTURING
We helped a leading manufacturer manage its production lines and reduce downtime due to unplanned stoppage
SUPPLY CHAIN
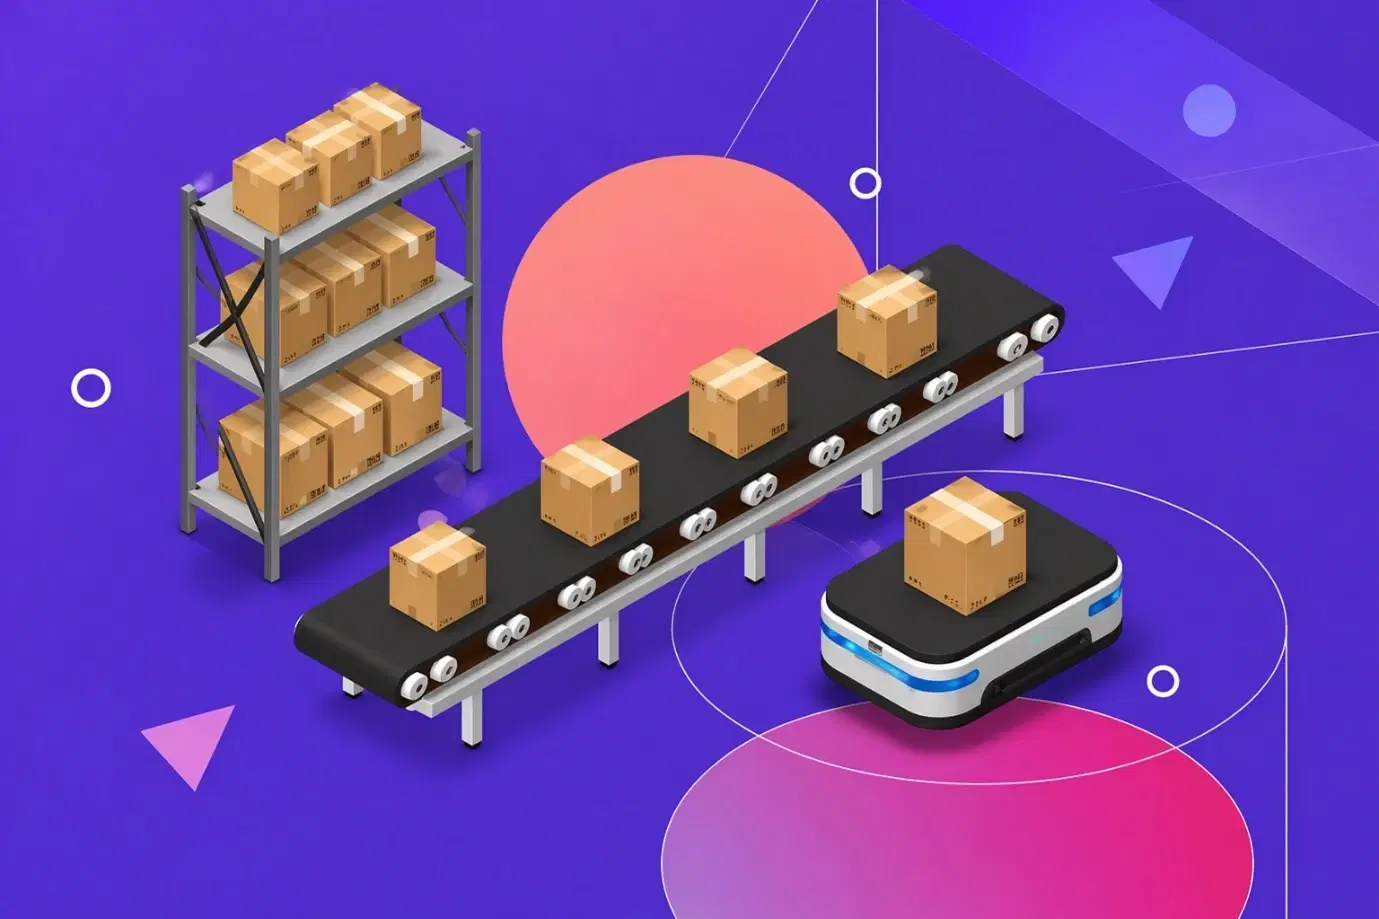
We helped an enterprise improve supply chain visibility and enable real-time decision-making across operations

ENERGY & UTILITIES
We helped a leading utility automate customer service workflows, reducing response time and operational effort

BFSI
Reducing Knowledge Search Time Using Enterprise RAG for BFSI Operations
Insurance
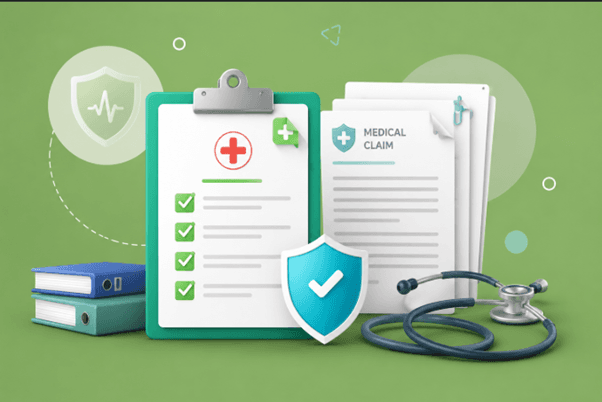
Automating Medical Claims Adjudication to Reduce Processing Time and Manual Effort

Insurance
Reducing Manual Call Audits Using GenAI for Insurance Quality Assurance

Insurance
Cutting Underwriting Decision Time Through Document Intelligence

BFSI
Improving Loan Processing Turnaround Through Automated Document Verification

FINANCIAL SERVICES
Agentic AI-Powered RM Copilot Reduces Operations Dependency by Up to 75%
MANUFACTURING
Reducing QC Story Documentation Effort by 80%+ Through AI-Guided Automation
CUSTOMER OPERATIONS
Cutting Customer Email Response Time by 98% Through Agentic AI Automation
CAPITAL MARKETS
Reducing Investor Meeting Prioritization Turnaround to Under One Hour with AI
RETAIL
Our data science solutions helped a major retailer reduce its wastage by 20% in Fruits and Vegetables category
RETAIL
We developed a sales forecasting engine for a CPG company in Africa leading to a 12% increase in forecast accuracy
CPG
We helped an Indonesian CPG leader realizer a 10% increase in ROI in their Promotional Strategy using Dynamic Pricing Optimized (DPO)
CPG
Our recommendation engine helped one of the largest CPG companies achieve additional 12% revenue lines for the company
HEALTHCARE & PHARMACEUTICALS
We helped a pharma leader reduce their time for drug development by cutting their initial research time by 65%
HEALTHCARE & PHARMACEUTICALS
We partnered with a leading pharmaceutical company to develop HCP Persona Analytics Engine leading to an incremental 35% lift in their engagement
BFSI
We helped an NBFC realize dynamic pricing recommendations leading to an incremental revenue lift of 3%
BFSI
We transformed portfolio management through intelligent automation with 90% reduction in man-hours
RESTAURANTS & HOSPITALITY
We partnered with one of the biggest food chains to deploy a data-driven system leading to a 22% increase in revenue
LOGISTICS
We helped a major logistic company achieve 100% if its SLA using our route optimizer & resource management solution
MANUFACTURING
We partnered with a global manufacturer to restore high quality production line
MANUFACTURING
We helped a leading manufacturer manage its production lines and reduce downtime due to unplanned stoppage
SUPPLY CHAIN
We helped an enterprise improve supply chain visibility and enable real-time decision-making across operations
ENERGY & UTILITIES
We helped a leading utility automate customer service workflows, reducing response time and operational effort
BFSI
Reducing Knowledge Search Time Using Enterprise RAG for BFSI Operations
Insurance
Automating Medical Claims Adjudication to Reduce Processing Time and Manual Effort
Insurance
Reducing Manual Call Audits Using GenAI for Insurance Quality Assurance
Insurance
Cutting Underwriting Decision Time Through Document Intelligence
BFSI
Improving Loan Processing Turnaround Through Automated Document Verification
FINANCIAL SERVICES
Agentic AI-Powered RM Copilot Reduces Operations Dependency by Up to 75%
MANUFACTURING
Reducing QC Story Documentation Effort by 80%+ Through AI-Guided Automation
CUSTOMER OPERATIONS
Cutting Customer Email Response Time by 98% Through Agentic AI Automation
CAPITAL MARKETS
Reducing Investor Meeting Prioritization Turnaround to Under One Hour with AI