Financial Services
Cutting Report Generation Time by 70% Through a Unified Data Platform

Impact Snapshot
IMPACT SNAPSHOT
We made a visible and measurable impact to our client’s business.
- 70% reduction in report generation time
- 30% reduction in manual reporting effort
- 95% improvement in data accuracy
- 24×7 access to business and operational insights
The centralized platform improved the speed and reliability of reporting while giving business teams a more consistent view of performance across functions.
Challenge
INDUSTRY OVERVIEW
Housing finance institutions generate large volumes of customer, loan, underwriting, portfolio and collections data across multiple operational systems.
As branch networks and product portfolios grow, different teams often depend on separate applications and reporting processes. This fragmentation can create inconsistent business definitions, increase reporting effort and make it difficult to establish a common view of performance across regions and functions.
The challenge is not simply storing data in one location. Institutions need to ensure that the same information can be processed consistently, governed appropriately and made available to business teams in time to support decisions.
THE PROBLEM
A leading housing finance company with a wide branch network had financial and operational information distributed across multiple systems and brands.
This fragmentation limited visibility into loan and deposit performance and prevented the organization from establishing a unified enterprise view of its data.
The organization lacked a centralized data platform for analytics and reporting. Data remained distributed across different sources, reporting required significant manual effort and automated triggers for important leading and lagging indicators were not available.
The business needed a centralized data warehouse that could become a single source of truth while enabling automated reporting, reliable analytics and faster decision-making across the organization.
OUR ROLE
Ganit was brought into design and implement a unified AWS-based data platform covering ingestion, processing, modelling and enterprise reporting.
The mandate was to centralize information from disparate business systems, automate recurring data workflows, standardize business definitions and create a governed reporting environment.
The engagement also needed to improve data accuracy and make updated information consistently available to teams across Sales, Marketing, Collections, Underwriting and other business functions.
Our approach
METHODOLOGY
The engagement followed the data journey from source system to business decision.
First, how could information from multiple enterprise systems be brought together reliably?
The platform needed to ingest data from applications such as Salesforce and Oracle without depending on repeated manual intervention.
Second, how could different datasets be standardized into a common enterprise view?
A unified analytical model was required so dashboards and reports could operate from the same business definitions and underlying data.
Third, how could reporting become faster and more repeatable?
Historical and incremental processing needed to be automated so updated information could flow into dashboards on a recurring basis.
Finally, how would the data be consumed by business teams?
The analytical layer was designed around actual reporting and monitoring requirements across functions rather than treating the warehouse as an isolated technology implementation.
SOLUTION STRUCTURE
We built an integrated data system to enable centralized reporting and analytics at scale.
Layer 1: Data Ingestion and Centralization
A centralized AWS Data Lake was established by integrating information from disparate enterprise sources, including Salesforce and Oracle.
Amazon AppFlow and AWS Glue were used for automated daily ingestion, while AWS Step Functions orchestrated historical and incremental processing. This reduced dependence on manual movement of data and created a repeatable path from source systems into the central analytical environment.
Layer 2: Data Modelling and Decision Support
Curated information was structured using a unified star-schema model and loaded into Amazon Redshift, establishing a single source of truth for enterprise reporting.
Data marts were then created to support business-facing dashboards including:
- Collections Dashboard
- Business Dashboard
- Underwriting Eye
- Early Mortality
- ENR
These data marts were integrated with Tableau and refreshed daily, supporting teams across Sales, Marketing and Collections with updated information for monitoring and decision-making.
Layer 3: Data Pipelines, Governance and Orchestration
The underlying workflows were automated using managed AWS services.
AWS Lake Formation supported centralized governance, IAM-based controls managed access to sensitive data and AWS Step Functions coordinated processing workflows.
Automated incremental processing allowed the platform to incorporate new data without repeatedly processing the entire environment, creating a controlled and repeatable analytical workflow from ingestion through reporting.
ENABLING CONSUMPTION
The platform was designed to ensure that centralized data translated into everyday business use.
Daily-refreshed dashboards gave teams a consistent view of important commercial, operational and risk indicators, including fresh logins, sanctions, sanction value, disbursement value, approval rates, insurance penetration, blended yield and risk delinquency.
Branch-level views also enabled teams to examine risk and portfolio performance at a more granular level, converting centralized information into business-facing reporting rather than leaving it confined to the data warehouse.
Standardized data models also meant that different dashboards could operate from the same governed definitions, reducing inconsistencies between reports.
A valuable difference
OUR IMPACT
The unified data platform materially improved the speed, accuracy and accessibility of enterprise reporting.
Report generation time decreased by 70%, helping shorten the time required to move from data preparation to business review. Automation also reduced manual reporting effort by 30%, allowing teams to spend less time compiling information and more time analysing performance.
Establishing a single source of truth improved data accuracy by 95%, strengthening confidence in the information being used across reports and dashboards. Business and operations teams also gained 24×7 access to updated insights, improving visibility across branches, products and business functions.
The centralized view additionally supported improved portfolio visibility, risk monitoring and underwriting efficiency by giving teams access to more consistent information across the organization.
The result was a reporting environment where business teams could access trusted information faster, reduce manual preparation and make decisions using a common view of enterprise data.



MANUFACTURING
Reducing QC Story Documentation Effort by 80%+ Through AI-Guided Automation

CUSTOMER OPERATIONS
Cutting Customer Email Response Time by 98% Through Agentic AI Automation
CAPITAL MARKETS
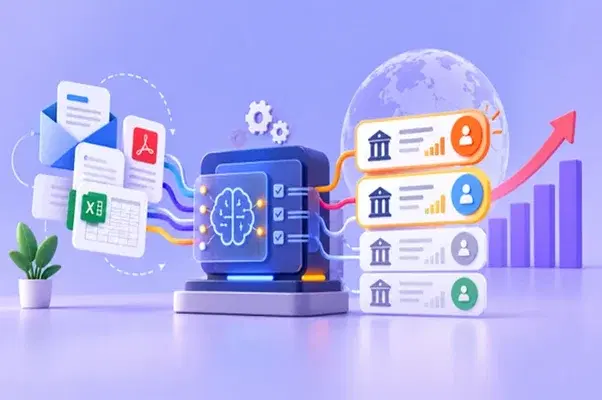
Reducing Investor Meeting Prioritization Turnaround to Under One Hour with AI

RETAIL
Our data science solutions helped a major retailer reduce its wastage by 20% in Fruits and Vegetables category

RETAIL
We developed a sales forecasting engine for a CPG company in Africa leading to a 12% increase in forecast accuracy

CPG
We helped an Indonesian CPG leader realizer a 10% increase in ROI in their Promotional Strategy using Dynamic Pricing Optimized (DPO)

CPG
Our recommendation engine helped one of the largest CPG companies achieve additional 12% revenue lines for the company

HEALTHCARE & PHARMACEUTICALS
We helped a pharma leader reduce their time for drug development by cutting their initial research time by 65%

HEALTHCARE & PHARMACEUTICALS
We partnered with a leading pharmaceutical company to develop HCP Persona Analytics Engine leading to an incremental 35% lift in their engagement

BFSI
We helped an NBFC realize dynamic pricing recommendations leading to an incremental revenue lift of 3%
BFSI
We transformed portfolio management through intelligent automation with 90% reduction in man-hours

RESTAURANTS & HOSPITALITY
We partnered with one of the biggest food chains to deploy a data-driven system leading to a 22% increase in revenue

LOGISTICS
We helped a major logistic company achieve 100% if its SLA using our route optimizer & resource management solution

MANUFACTURING
We partnered with a global manufacturer to restore high quality production line

MANUFACTURING
We helped a leading manufacturer manage its production lines and reduce downtime due to unplanned stoppage
SUPPLY CHAIN
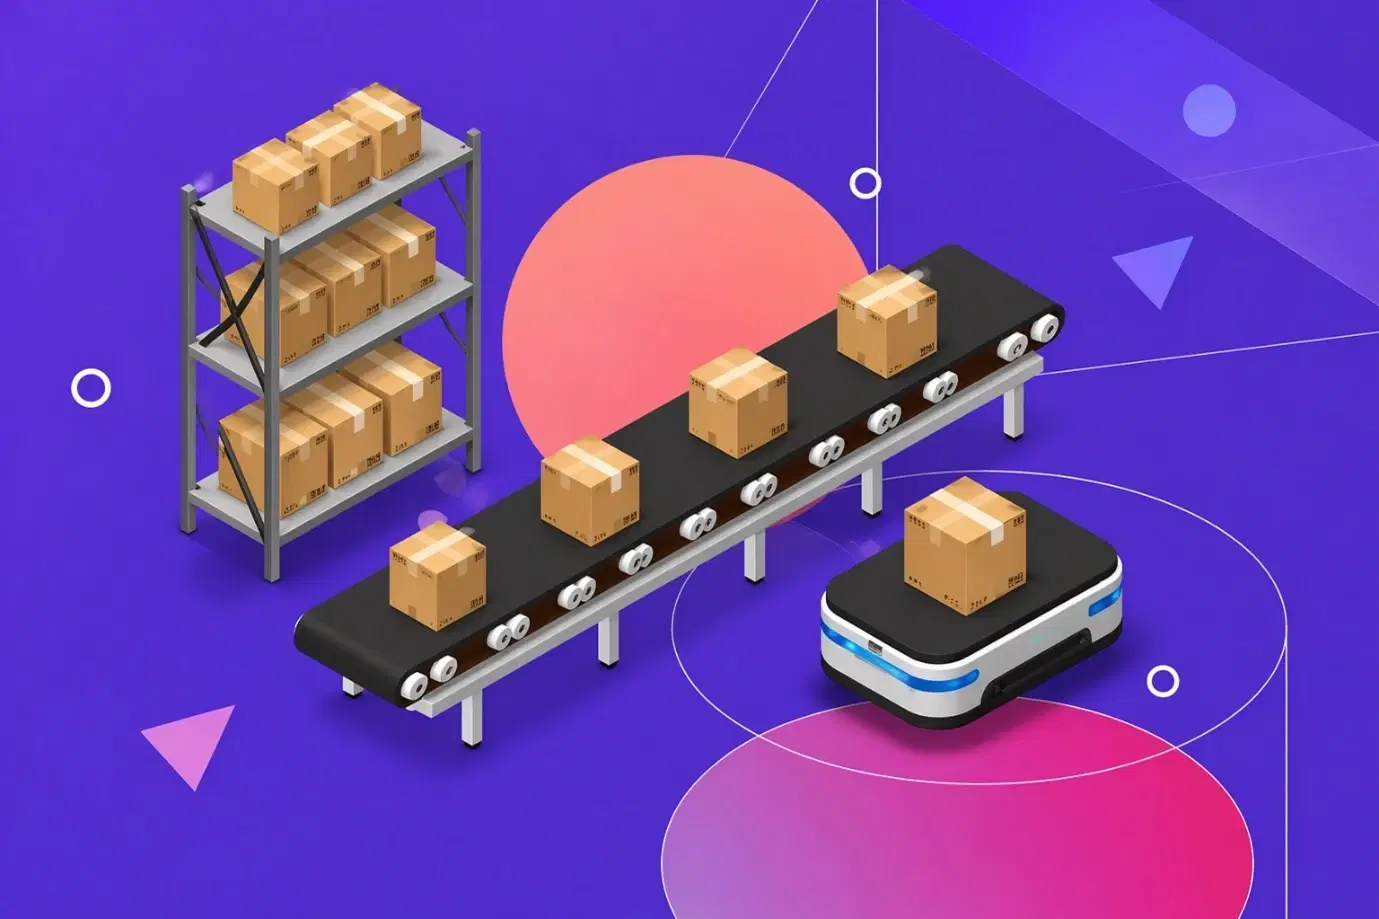
We helped an enterprise improve supply chain visibility and enable real-time decision-making across operations

ENERGY & UTILITIES
We helped a leading utility automate customer service workflows, reducing response time and operational effort
BFSI
Reducing Knowledge Search Time Using Enterprise RAG for BFSI Operations
Insurance
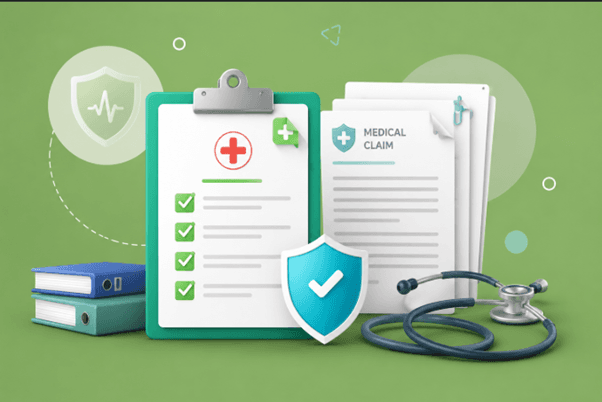
Automating Medical Claims Adjudication to Reduce Processing Time and Manual Effort

Insurance
Reducing Manual Call Audits Using GenAI for Insurance Quality Assurance

Insurance
Cutting Underwriting Decision Time Through Document Intelligence

BFSI
Improving Loan Processing Turnaround Through Automated Document Verification

FINANCIAL SERVICES
Agentic AI-Powered RM Copilot Reduces Operations Dependency by Up to 75%
MANUFACTURING
Reducing QC Story Documentation Effort by 80%+ Through AI-Guided Automation
CUSTOMER OPERATIONS
Cutting Customer Email Response Time by 98% Through Agentic AI Automation
CAPITAL MARKETS
Reducing Investor Meeting Prioritization Turnaround to Under One Hour with AI
RETAIL
Our data science solutions helped a major retailer reduce its wastage by 20% in Fruits and Vegetables category
RETAIL
We developed a sales forecasting engine for a CPG company in Africa leading to a 12% increase in forecast accuracy
CPG
We helped an Indonesian CPG leader realizer a 10% increase in ROI in their Promotional Strategy using Dynamic Pricing Optimized (DPO)
CPG
Our recommendation engine helped one of the largest CPG companies achieve additional 12% revenue lines for the company
HEALTHCARE & PHARMACEUTICALS
We helped a pharma leader reduce their time for drug development by cutting their initial research time by 65%
HEALTHCARE & PHARMACEUTICALS
We partnered with a leading pharmaceutical company to develop HCP Persona Analytics Engine leading to an incremental 35% lift in their engagement
BFSI
We helped an NBFC realize dynamic pricing recommendations leading to an incremental revenue lift of 3%
BFSI
We transformed portfolio management through intelligent automation with 90% reduction in man-hours
RESTAURANTS & HOSPITALITY
We partnered with one of the biggest food chains to deploy a data-driven system leading to a 22% increase in revenue
LOGISTICS
We helped a major logistic company achieve 100% if its SLA using our route optimizer & resource management solution
MANUFACTURING
We partnered with a global manufacturer to restore high quality production line
MANUFACTURING
We helped a leading manufacturer manage its production lines and reduce downtime due to unplanned stoppage
SUPPLY CHAIN
We helped an enterprise improve supply chain visibility and enable real-time decision-making across operations
ENERGY & UTILITIES
We helped a leading utility automate customer service workflows, reducing response time and operational effort
BFSI
Reducing Knowledge Search Time Using Enterprise RAG for BFSI Operations
Insurance
Automating Medical Claims Adjudication to Reduce Processing Time and Manual Effort
Insurance
Reducing Manual Call Audits Using GenAI for Insurance Quality Assurance
Insurance
Cutting Underwriting Decision Time Through Document Intelligence
BFSI
Improving Loan Processing Turnaround Through Automated Document Verification
FINANCIAL SERVICES
Agentic AI-Powered RM Copilot Reduces Operations Dependency by Up to 75%
MANUFACTURING
Reducing QC Story Documentation Effort by 80%+ Through AI-Guided Automation
CUSTOMER OPERATIONS
Cutting Customer Email Response Time by 98% Through Agentic AI Automation
CAPITAL MARKETS
Reducing Investor Meeting Prioritization Turnaround to Under One Hour with AI