Intelligent Demand forecasting for procurement and auto replenishment in a Fast Fashion Apparel Retailer
February 2023 | 14-minute read

Tagged: ApparelRetail | DemandForecasting | InventoryManagement | DataAnalytics | WorkingCapitalOptimization | RetailChallenges | RetailSolution | AWSAdvancedPartner | DataInsights | SupplyChainOptimization | AIandML | RetailProfitability | InventoryTurns | BusinessImpact | MLProcurement
Gauging market demand for the Apparel retail industry is challenging. The success of Stock Keeping Unit (SKUs) sold in this market depends on customer preference (fitting, feel, regional acceptance etc.) and latest trends, which change frequently. Due to these ever-changing trends, large amount of stock remains unsold, impacting retailers’ working capital in the short term (3–6 months) and eventually leading to large liquidation of leftover stock, reducing the overall company’s profitability.
Ganit is an AWS Advanced Tier Services Partner that provides intelligent solutions at the intersection of hypothesis-based analytics, discovery-driven artificial intelligence (AI), and new-data insights. Over the years, they have successfully deployed inventory management systems using intelligent demand forecasting at the core of their solutions. This system has helped many of their clients optimize their inventory leading to efficient working capital deployment and improvement in topline and bottom-line numbers.
Challenge Faced by customer:
Ganit’s customer is an apparel retailer selling more than ~1,500 unique SKUs at any point across its chain of stores within the country. Demand patterns for its SKUs vary significantly across stores due to the diverse geographical presence within the country. A single Apparel Centre of excellence (COE) team carries procurement and replenishment activity through a central warehouse (lead time to store varies between 1–7 days) for all SKUs.
Two key challenges in running its operations by customer:
- Decisions on what and how much to procure (procure to sell model) for all seasonal/fast fashion SKUs are made by Subject Matter Experts (SMEs), which is “gut” based, leading to ~40% of all its SKUs procured liquidated as stock clearance sales post 6 months of purchase, impacting overall profit margins.
- Regular selling SKUs (like white T-shirts, socks, and inner garments) are replenished from the warehouse (procurement to replenish model) which lacked enough manpower, leading to improper inventory allocation across stores and causing over & under-stock events regularly.
The above 2 challenges impact negatively on multiple KPIs like inventory turns, working capital, stockouts, overstocking, higher procurement costs, increase in product damages leading to topline and bottom-line impact.
Solution Approach overview:
To address the challenges faced by the customer, we recommended a Two-part solution for initial stock allocation and stock replenishment.
Solution design was split into two parts:
- An item attribute-based demand forecasting method for the fast fashion SKUs was chosen as these SKUs didn’t have any historical data for modelling. Item attributes like colour, size, type, price range were selected as model levels for demand forecasting.
- Automated intelligent demand forecasting and an inventory optimization approach were used to address the inventory allocation issue. The demand forecasting engine was designed to use historical and external demand drivers (promotion, weather etc.) The inventory optimization engine was designed to accommodate varying demand, lead time, supply chain constraints like minimum order quantity and service unit factors.
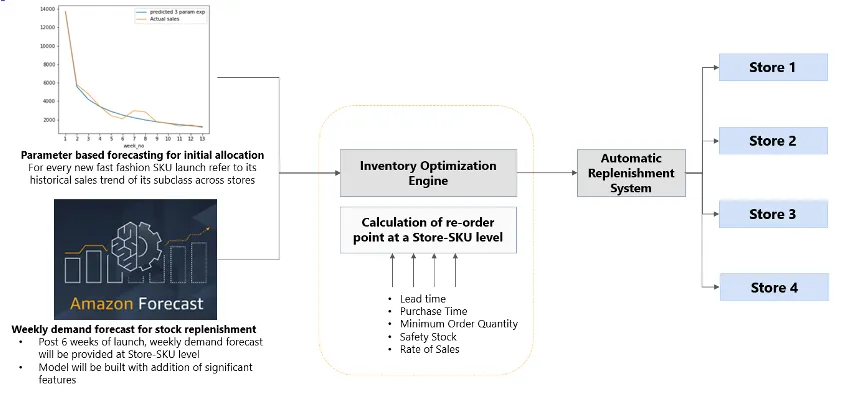
Figure 1: Overall approach to building automated replenishment system
Attribute based demand forecasting:
To study the demand pattern of fast fashion SKUs, historical sales were time adjusted based on 1st day of sales till 183 days of sales (refer to figure 2) using Jupyter notebook on Amazon SageMaker.
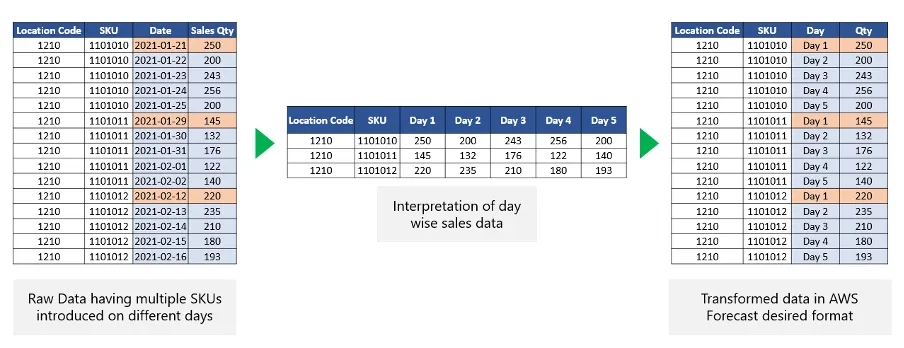
Figure 2: Standardizing the data based on first sales date for Target Time Series Forecasting
Analyzing the data, we observed that SKUs followed an exponential decay pattern of sales at overall Org level with fluctuating demand at granular level (refer to figure 3).
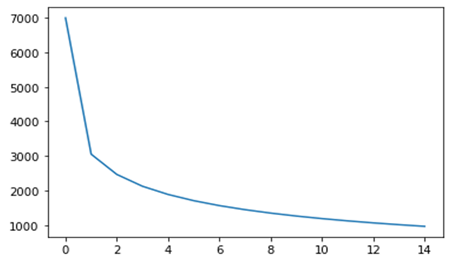
Figure 3: Overall sales pattern across stores, high sales volume initially followed by a decay in sales
Based on the distribution of the demand observed, 3 models were chosen i.e., GLM (Gamma Distribution), 2 parameter exponential curve and 3-parameter exponential curve. These models were built using the custom model feature on Amazon SageMaker. WAPE metric was used to measure the accuracy of the models.
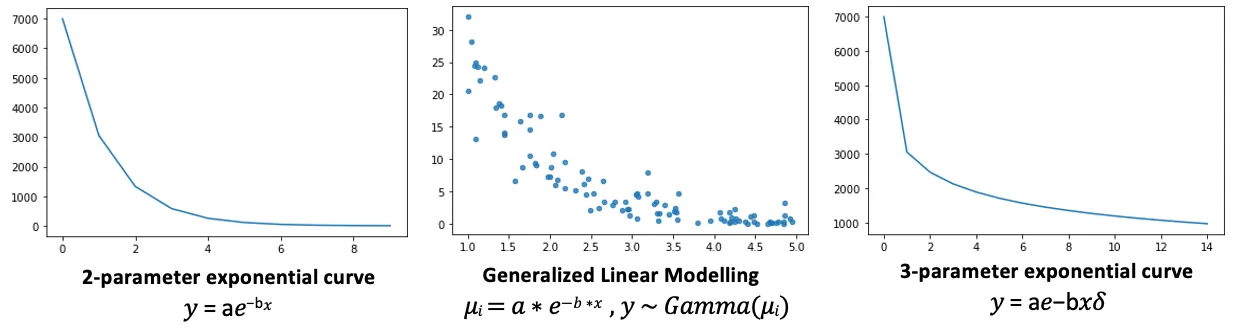
Figure 4: Statistical model chosen for model fit on historical time adjusted sales data
3-Parameter model had the best model fit accuracy among the models chosen. This was due to the decay parameter in the model, which makes the decay faster initially then slows it down (like what was observed in the sales trend). Model fit results at lower hierarchy levels are as shown in the image. For simplicity in understanding, SKUs were classified into ABC segments based on their saliency.
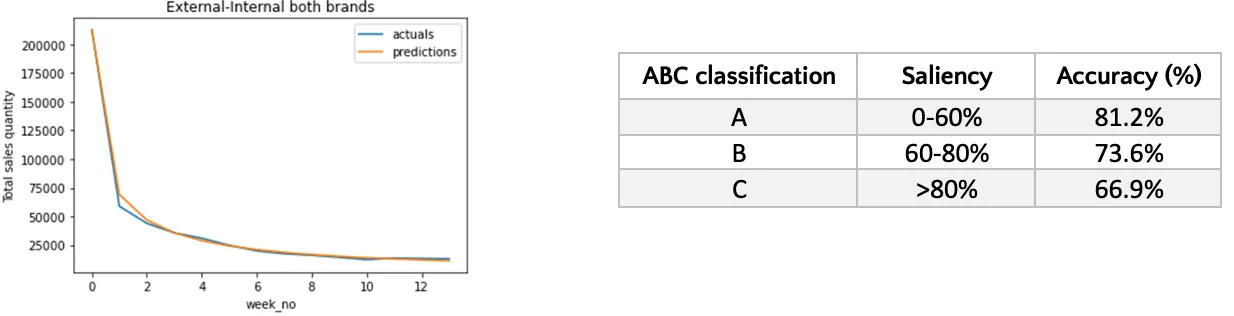
Figure 5: Model Fit output for 3-parameter exponential model
Overall model fit accuracy of the 3-parameter model is 72.4% across All India SKUs for period Apr 2019 to Sep 2019
Using the outputs from the 3-parameter model, a decision board was designed using Amazon QuickSight. This decision board provided guidance to the business to procure SKUs and distribute them across stores based on the attributes.
With this decision board the decision-maker can
- Get an estimate on what quantity they can procure overall, in accordance to the budget allocated for procuring a new fast fashion SKU
- Efficiently allocate those procured SKUs based on probability of success, shelfspace available etc.,
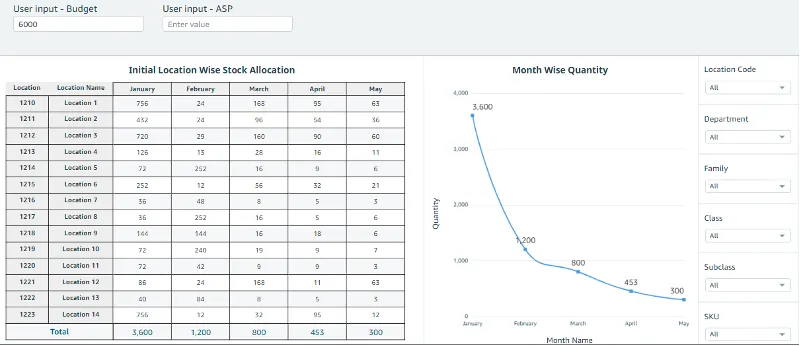
Figure 6: Snapshot of decision board for Fast Fashion SKU procurement and initial allocation
Intelligent demand forecasting & Inventory optimization for regular SKUs:
For regular SKUs, the auto replenishment model has 2 engines:
- Intelligent demand forecasting model
- Inventory management system
Demand Forecasting Engine:
AWS Forecast was chosen to build the intelligent forecasting model for the auto-replenishment system. This model was designed to predict demand at Store-SKU-Week level for rolling 6 weeks.
Datasets used:
- Historical target time series data (TTS) — A model used to learn sales trends and seasonality.
- Regressor Time Series (RTS) data — Factors like promotion, liquidation, stock-outs, and holidays model used to learn the impact on demand due to events that occurred in the past.
- Store-Item Metadata — This information was used for model capture the synergies like Halo and cannibalization effect between SKUs.
TTS, RTS and Store-Item Metadata were fed as the inputs to Amazon Forecast. Ganit tried and tested multiple modelling techniques, namely ETS, Arima and its variations, Prophet, CNN-QR, and Deep AR+ (AutoML feature was also used). CNN-QR model produced the best acceptable results and was chosen as the forecasting model.
During the model design, three forecasts were generated at p40, p50, and p60 quantiles, with p50 being the base quantile which had equal probability of both over and under forecast. The selection of quantiles was based on SKU classification (SKUs were classified into fast- and slow-moving SKUs based on Days of Inventory of the SKU). p60 was chosen for fast-moving SKUs, as the business impact of customer loss was significantly higher than holding extra inventory, and p50 was chosen for slow-moving SKUs.
Once the forecast export was complete, the files were combined to yield the consolidated forecast file. Using the historical estimates, Ganit ran the forecast file through its bias corrector mechanism to adjust for bias and select the right quantile for store-SKU combinations.
Inventory management system:
There are 2 key elements required to build an efficient inventory management system i.e., 1. Safety stock (SS) and 2. Reorder point (ROP).
Ganit incorporated the forecasted demand and its variability in calculating the SS and ROP for an efficient stock replenishment system and proper allocation of SKUs across different stores.
Safety Stock = Minimum Display Quantity at store + Demand Variability
Reorder point = SS + Rate of Sale (ROS) * (Warehouse to Store Lead Time + Purchase Time)
Automated alerts and transfer order from warehouse to stores were raised when net inventory at store (i.e., Stock on Hand at store + Stock in Transit + Stock allocated to the store) was less than re-order point.
The automated inventory management system helped the client eliminate manual intervention in their procurement team thereby minimizing stockout conditions caused because of manpower shortage.
Production System development:
A robust technical architecture for the production system was designed and implemented, following AWS Well-Architected best practices, enabling a sustainable, scalable, and cost-effective tool.
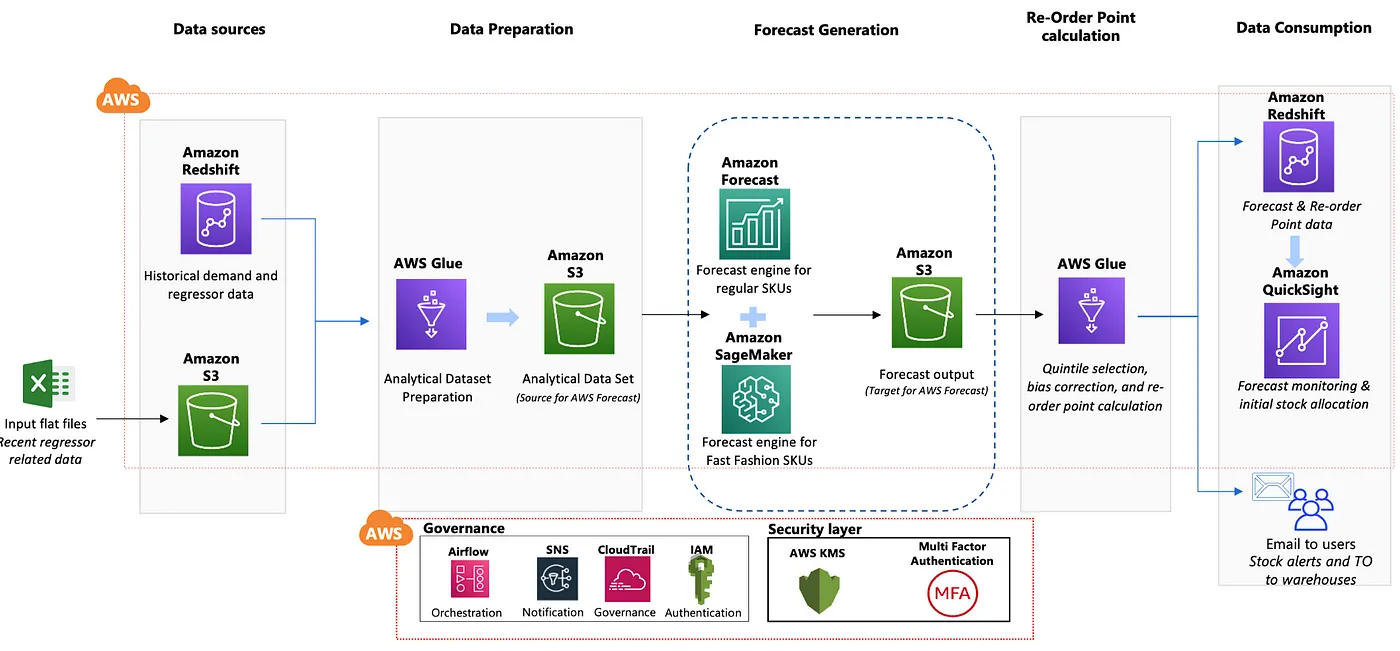
Figure 7:Production system technical Architecture for the automated replenishment system for regular SKUs
- Historical demand and regressor time series data was stored in Amazon Redshift, an optimized data warehouse with massive data processing speed for instantaneous data retrieval
- The latest regressor related information was loaded to Amazon Simple Storage Service (S3) by the business users to have an updated data repository for the forecast model development
- Amazon SageMaker was used to identify the hypothesis list and perform required analysis to understand the correlation between the regressors and demand
- Amazon Simple Storage Service (Amazon S3) was a transformed data layer with cleaned and processed data ready for analytical consumption and to store the forecast outputs from AWS Forecast
- Amazon Forecast was used to test and run different models (from ARIMA, Prophet, ETS, BSTS, Deep AR+ and CNN-QR) to improve the accuracy levels
- AWS Glue was used for running bias correction mechanism and perform re-order point calculation with the stock related (near real time) inputs from the data warehouse
- Amazon QuickSight was used to estimate the procurement quantity based on the budget provided by the user and allocate the SKUs across the stores
- E2E process was in AWS ecosystem which was secured through its innate features like IAM access policies, security group & VPC, row-level security for certain users and E2E data encryption using AWS Key Management Service (KMS)
Business Impact:
For Fast Fashion SKUs, we observed cost per invoice for procurement reduced by ~15% improving the working capital of the division. Efficient allocation of SKUs led to increased revenue by ~3% reduction in damage of goods (shrinkage loss) by ~18%, thereby improving both the top line and bottom line of the business unit.
For regular SKUs, we defined the baselines as a weighted average of the last four weeks for the same day (in the absence of a forecasting model earlier), and we estimated a ~12% improvement in forecast accuracy, i.e., from 71% to 83%. This automated replenishment system reduced inventory turns by ~2 days (improved working capital), reduced stockout by ~3% and a topline increase of ~1.4%.
Conclusion:
An ML-based procurement and auto-replenishment system helped the client unlock value in its existing value chain. Given the current dynamics and competition in the market, companies like our client need to work towards unleashing the true capabilities of data, machine learning and AI.
To give your supply chain operations an edge using the power of ML and data analytics, Ganit recommends that you apply Amazon Forecast and Amazon SageMaker to unlock additional value from your existing system. To learn more about Ganit and its solutions, reach out at info@ganitinc.com.