Intelligent Demand forecasting for inventory optimization using Amazon Forecast
April 2023 | 10-minute read

Tagged: DemandForecasting | InventoryOptimization | SupplyChainManagement | AmazonForecast | BusinessIntelligence | DataAnalytics | RetailIndustry | CPGIndustry | Manufacturing | ForecastAccuracy | InventoryManagement | AWSIntegration | DataScience | SupplyChainOptimization | PredictiveAnalytics
Businesses of various sizes, scopes and scales face multiple challenges like Overstocking, causing limited working capital, slow-moving inventory, and stock liquidation, eventually impacting their bottom-line number. Some businesses face understocking, leading to loss of sales, customers, bad reviews and an overall decline in top-line numbers. Most companies face an issue of both under and overstocking across various Stock Keeping Unit (SKU) types, leading to both top-line and bottom-line impact
Let me give you some cross industry examples of the improper demand forecasting leads to value loss in the supply chain ecosystem
- Retail Industry: Large apparels retailer in India were facing a constant increase in liquidation (~40% of SKUs procured) after six months of purchase. It affected their overall profit margins.
- CPG Industry: A large CPG company was facing regular stockouts (~8% — 10% at monthly-SKU level) for their Platinum (key) SKUs, indirectly affecting their revenue
- Manufacturing Industry: A medical device manufacturer was facing a cash crunch due to high capital invested in slow-moving inventory (4x of demand) in its manufacturing plant
Why do these organisations face this challenge?
In recent times many organizations have moved from the traditional practice of Subject Matter Expert (SMEs) “gut” based forecast or reference months (last four months average, last year same time average) based forecasting to statistically driven forecasting models. However, they continue to face such challenges due to
- All SKUs are forecasted using similar techniques, and they are predicted in isolation from each other
- Demand forecast is generated based on its historical sales only (time series models like Holt Winter’s and ARIMA), and the impact of demand variables (like seasonality, promotion, competition, etc.,) is adjusted based on business understanding and planned promotion by the SMEs/department head
- Limited or no ability to configure forecast for short-term demand fluctuations
- Synergies between SKUs (Cannibalization/halo effect) are not considered for forecasting
What should business do to overcome this challenge?
Businesses need to leverage intelligent demand forecasting techniques for their demand planning, which not only uses historical demand but also considers
- Variability of demand of individual SKUs and identify suitable model for the same
- Measures the impact of demand-impacting variables like promotion, discounts, festivals and other macroeconomic and dynamic business change
- Captures the synergies between SKUs and adjusts automatically due to short-term fluctuations in demand
Building an intelligent demand forecasting system:
To build an intelligent demand forecasting system, businesses (analysts/data scientists) need to go back to their drawing boards and determine demand drivers for their SKUs. One can achieve this by building a hypothesis matrix which is both collectively exhaustive and mutually exclusive from each other (MECE).
Upon completion of the hypothesis matrix, identify the data sets available. Doing this allows businesses to start capturing the information they weren’t before.
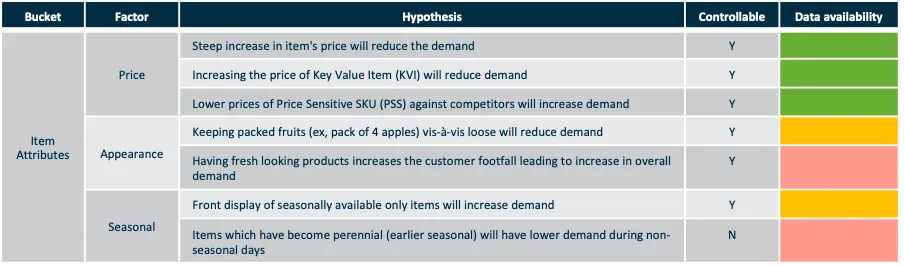
Figure 1:Sample view of an Hypothesis matrix and factor buckets
The next step allows businesses to constantly assess results, measure impact, and provide a feedback loop to the model, allowing it to improve consistently.
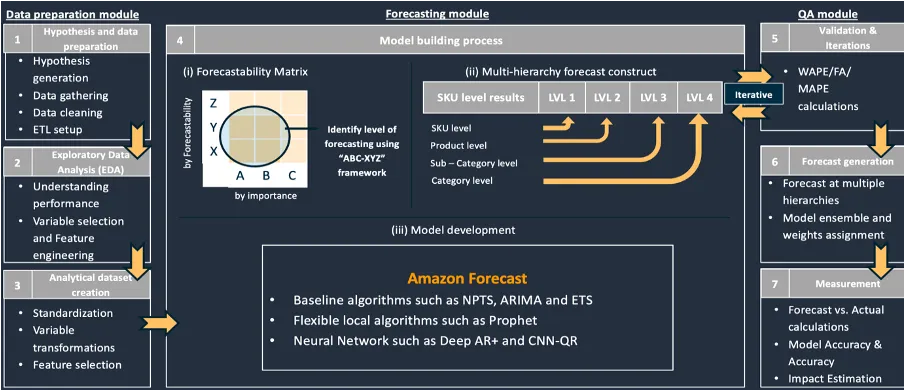
Figure 2:Summarising the Forecasting process
The entire process consists of three modules:
1. The Data Preparation module:
Data Preparation module consists of 3 substages:
Data gathering & cleaning: Data for hypothesis testing is identified and cleaned for testing using various techniques (missing value treatment, outlier treatment, value adjustment).
Hypothesis testing: For the available data, exploratory data analysis (EDA) is performed to test the hypothesis. EDA is performed in a way where hypotheses are validated both visually and statistically. Factors from these testing are then used as features in the demand forecasting model.
Analytical dataset creation: This process involves converting the features/factors identified into analytical datasets for forecasting purpose. This process may include various analytical techniques like Principal Component Analysis (PCA) and various other data transformation jobs.
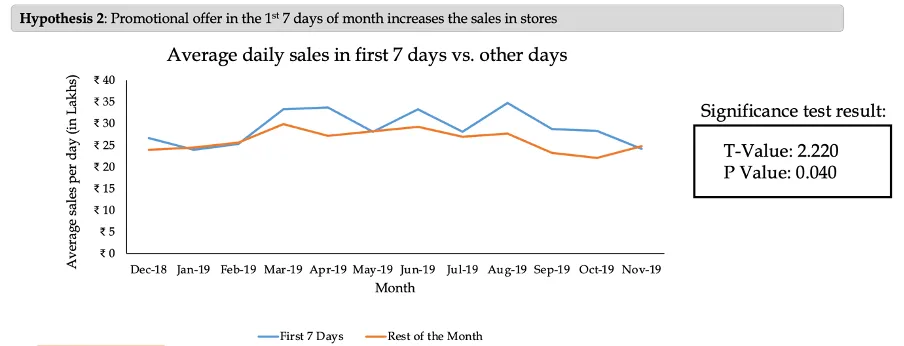
Figure 3: Sample output of Exploratory data analysis on promotion impact on sales
2. Forecasting module:
The forecasting module consists of three interrelated substages.
ABC-XYZ Framework SKUs are segmented across a 3X3 segment where the X-axis stands for the importance of SKUs to business (Pareto principle), and XYZ stands for the ability to forecast (Coefficient of Variation of the SKU). SKUs in AB-XY buckets are initially prioritized and deployed for businesses for immediate consumption. Multiple iterations and modelling techniques are used to improve the forecast accuracies of AZs (Pareto SKUs are prioritized). Companies can decide to continue/stop SKUs from the CZs bucket as they are highly volatile and have a low contribution to the business.
Amazon Forecast has an AutoML feature which enables businesses to test multiple models like traditional time series models, Regressor-based models and neural network-based models simultaneously. It also chooses the best-ensembled model for each SKU based on back-tested accuracies.
Higher order forecasting: Demand forecast needs to be performed at a higher level in specific scenarios and then disintegrated into SKU level using mathematical techniques to improve forecast accuracies.
3. Quality Assessment (QA) module:
The quality assessment module is an iterative process that syncs with the forecasting module. This process ensures the suitable model selection for SKUs based on consistent accuracies and bias exhibited during the testing period.
Upon model finalization, backdated business impact (overstock/understock) on the top line/bottom line is estimated during this stage before Go-Live.
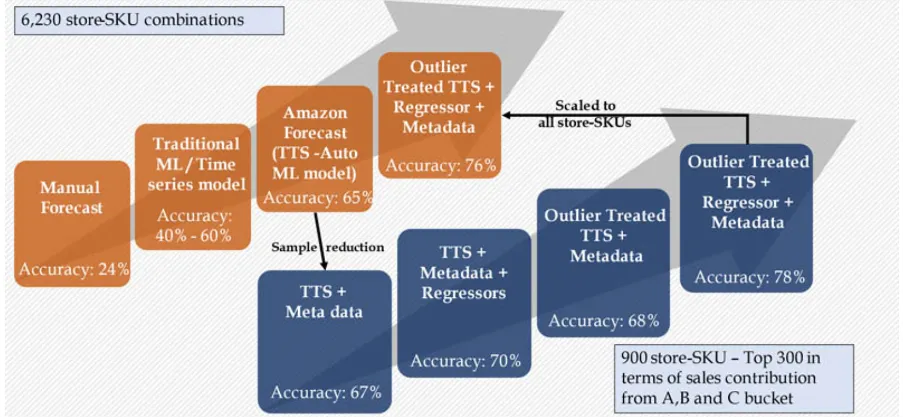
Figure 4: Representation of iterative process improving forecast accuracies
Note: The above image has been referenced from this APN Blog
Production system development:
To Go-Live, there is a need to build a robust production system that ensures the design is reliable, scalable, cost-efficient and highly secured. AWS cloud architecture suits perfectly for setting up such a system.
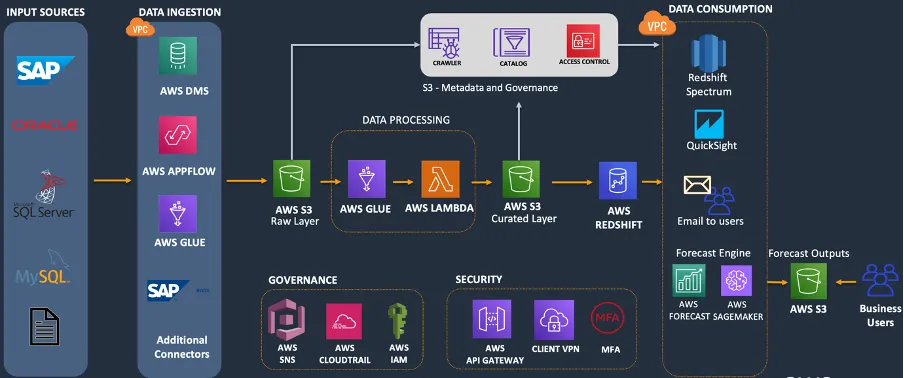
Figure 5: Representation of AWS Cloud Architecture to setup robust forecast solution
Sample technical architecture present in the figure can be followed by the business to set up the production system. The components of the production system can be chosen based on the input data source and levels of security and analysis required by the business.
Why choose Amazon Forecast?
A wide range of features provided by Amazon Forecast proved it to be the ideal platform for forecast generation. I want to highlight a few features which stand out the most.
- Amazon Forecast’s neural network model’s ability to understand and account for synergies between SKUs increases forecast accuracies in highly volatile SKUs (Z bucket) by up to 10% compared to traditional models.
- The ability to balance under-forecast and over-forecast scenarios for short-term demand fluctuations using the quintiles feature gives an additional edge to this system.
- Ease of integration with existing on-prem or cloud ERP systems (Oracle, SAP) with high levels of security (including security in transit) enables quick deployment of the solution in the production system.
- Ability to scale the model inputs with little to no additional effort.
Conclusion:
Designing and deploying an intelligent demand forecasting system on AWS Cloud using Amazon Forecast has helped businesses optimize their inventory and demand planning leading to a 5%-10% improvement in revenue and a 10% -15% drop in slow-moving inventory. To boost your supply chain operations, I recommend you explore Amazon Forecast and experience the improvement in forecast accuracy.
To learn more about Ganit and its solutions, reach out at info@ganitinc.com.